The Belgian personal income tax is the main source of revenue for the federal government1. Moreover, it is a crucial instrument to temper income inequality. Most Western countries have a progressive system, where marginal rates increase with income. In Belgium, you pay exactly 50% tax on every extra euro from an income of €41,360, or 50 euro cents (tax year 2022)2.
A marginal rate of 50% is roughly comparable to the highest rates of our neighboring countries today. However, the situation was very different in the past. In the United States, you paid 91% tax from a certain income threshold until 19633. From a certain income level, every additional dollar in the US (and also in the UK) was almost entirely taxed away. Today, such rates are almost unthinkable, but they were once a reality. Such a quasi-confiscation of the highest incomes effectively sets an income ceiling and reduces not only post-tax inequality but also pre-tax inequality. For employers, it hardly makes sense to pay higher wages than that threshold, as their employees would hardly gain any real income advantage from it.
We know that the highest personal income tax rates in various countries have been drastically reduced over the past decades, see for example this article. However, a clear historical picture of the marginal rates on the highest incomes is lacking for Belgium. In this piece, we first reconstruct the evolution of these top rates from World War II to today. Then we compare the personal income tax of 1988 with today’s system in terms of progressivity, total revenue, and the effect on inequality. Finally, we draw inspiration from the historical system to propose an alternative personal income tax.
The top rates of personal income tax over time
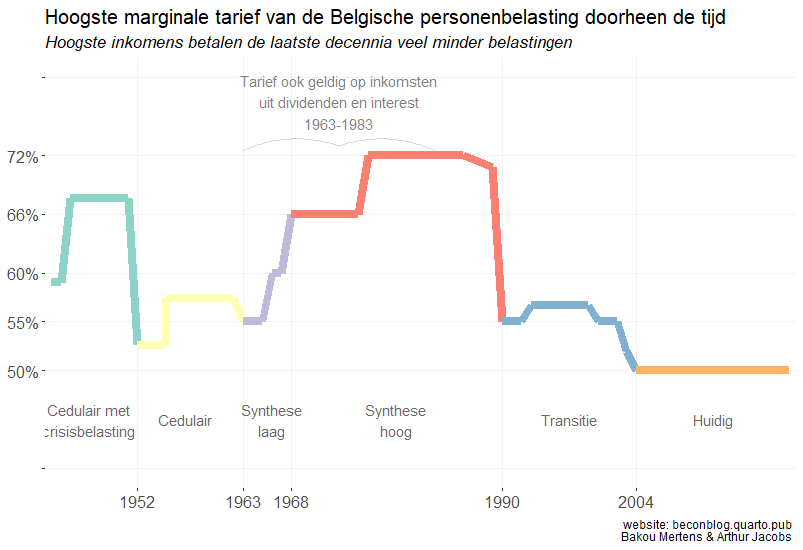
It was not so easy to get a clear view of how the highest incomes were taxed in the past, but through archival research, we can sketch a clear picture. Figure 1 shows the evolution of the highest marginal rate of income taxes for Belgium. This only concerns income taxes themselves: we exclude municipal taxes and social contributions. What do we find? Belgium also had much higher marginal rates on top incomes in the past, especially just after WWII and during the period 1968-1988. Not as high as in the US or the UK, but still much higher than what we know today and even what we can imagine today.
World War II and Les Trentes Glorieuses
Before the 1962 reform, Belgium had a complex system of so-called “cedular” taxes. Income from labor was subject to corporate tax, but also to the additional personal tax (or supertax). In 1955, the highest marginal rate of that corporate tax was, for example, 50.4%. It is important to note the peculiar system where you could deduct the corporate tax paid the previous year as a professional expense. This meant that the rate of 50.4% actually tended towards only 33.5%. What remained after the corporate tax was also subject to the additional personal tax with a top rate of 36%. Before 1952, there was also an additional national crisis tax with a top rate of another 15% on total income. This meant that in post-WWII Belgium, the highest marginal income rates could amount to almost 68%.
From 1963, the cedular tax system was abolished and replaced by a simpler, synthetic system. While our overview for this reform may still have gaps, our picture from then on is complete. The corporate tax and additional personal tax were merged into the personal income tax, and the deductibility of the paid tax as a professional expense was abolished. To compensate for the abolition of deductibility, a cap was introduced: the average effective tax rate could not exceed 50% of total income. In the early 1970s, this was increased to 55% and with the law of November 22, 1978, even to 67.5%.
Initially, the synthetic reform slightly reduced the tax burden on the highest incomes: the new top rate was 55%. However, with the law of December 27, 1965, this increased to 60%. By royal decree, the highest marginal rate was increased to 66% from 1968, and even to 72% in 1976. Through municipal surcharges—which did not count towards the calculation of the cap—the highest rates could practically rise to 80%. With such rates on the highest incomes, it is perhaps not entirely coincidental that income inequality in Belgium significantly decreased during this period.4
The swan song of progressivity
From 1990, the Belgian government did away with the high marginal top rates. The highest income tax rate abruptly dropped to 55%. It was slightly increased from 1993 to meet the European Maastricht criteria, but it never approached the rates of the 1980s again. Under the purple government of Verhofstadt, the highest personal income tax rate eventually dropped to 50%. Since then, it has not been adjusted. For almost two decades, the top rate has remained untouched, increasingly acquiring an untouchable status. The left does not really push for an increase, nor does the right for a decrease. A relatively limited adjustment of the tax brackets, as proposed by Van Petegem, seems the most achievable in a clogged political context. What turned out? Even for such a reform, there is currently a lack of political enthusiasm. We show below that it is nevertheless worthwhile to reform our labor taxation.
Towards a More Progressive Personal Income Tax: Drawing Inspiration from the Past
While the overview of the marginal top rates clarifies how the highest incomes have been treated over time in Belgium, it is also interesting to look at how the tax system of the past as a whole differed from today’s. We focus on 1988: it is relatively recent and also the last year before the drastic reduction of the top rates.
The rate structure of 1988 was much more complex than today’s. There were no fewer than thirteen different tax brackets (compared to four brackets today). Adjusted for inflation5 and GDP per capita growth6, the 1988 system in 2021 would result in the tax burden shown in Figure 2. This figure shows the effective tax rate as a function of annual gross income: it represents the percentage of your gross income that you pay to the tax authorities. This is shown for (1) the current system, (2) the 1988 system7, and (3) our own reform proposal inspired by the 1988 system. We always assume the minimum tax-free amount, not increased for dependents.
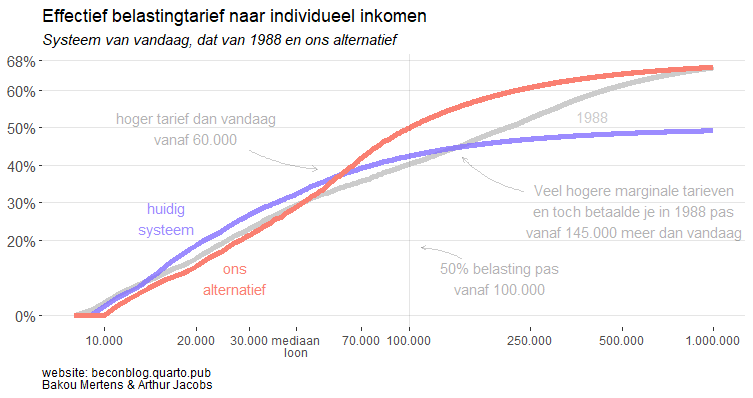
All three systems are clearly progressive, as the effective tax burden increases with income. However, the 1988 system confronted the highest incomes with a much higher tax burden. The middle class would also retain significantly more net income under the former personal income tax system. Notice how the effective tax rate today increases only slightly once you reach a high gross income. In other words, the progressivity of the tax system is quite limited for the highest income regions today. It was different in the past: under the 1988 system, the highest earners paid a significantly larger portion of their income in taxes than the well-earning middle class.
However, reintroducing the old system would not be a panacea. A first problem becomes clear based on Figure 3. The tax-free amount in 1988 is lower than in the current system, and consequently, the lowest incomes are worse off. Moreover, the system is very generous to the (very) high middle class: those earning a gross annual income of €70,000 (or almost €6,000 monthly) would retain €2,424 more net annually after switching to the old system compared to today. Only the highest incomes, those earning more than €145,000, are worse off in the old system. Consequently, the former personal income tax system generates significantly less revenue than the current one (see the methodological note at the end of this article).
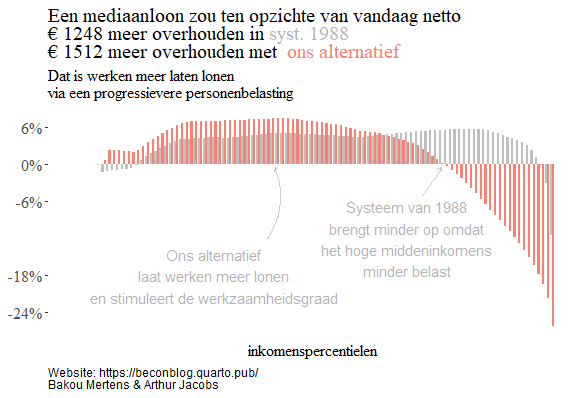
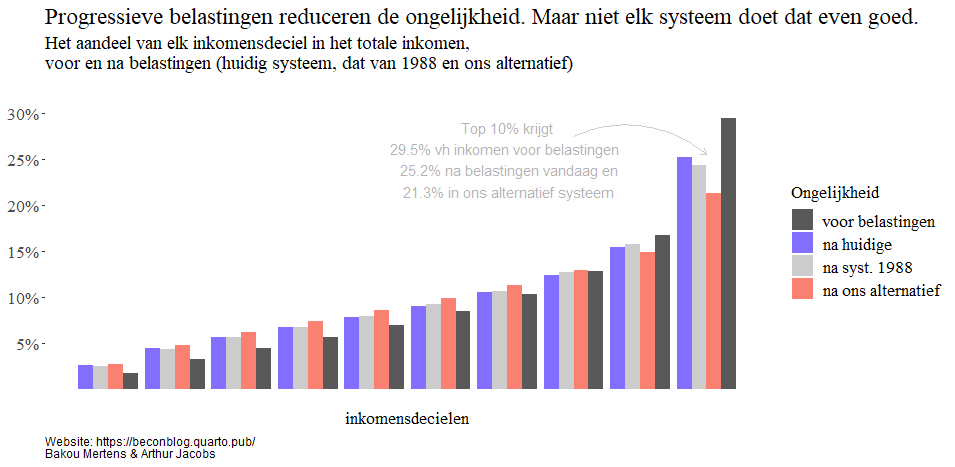
Figure 3 shows the impact on net income for different income percentiles if we switch to the 1988 income tax system. The last gray bar shows that the top 1% of earners would earn an average of 11.5% less net annually than today. However, the majority of the population benefits from the reform. To some extent, the reform is too good to be true: the reform is deficitary. The Belgian state would receive 6.3% less in tax revenue from the working population, which is unacceptable in the current budgetary context. Additionally, the 1988 system does not drastically reduce inequality, as the Gini coefficient only decreases by 0.4 percentage points. Figure 4 shows how the total income distribution looks under the different regimes: for each income decile, it indicates what portion of the total wage mass flows to that 10% of the population. The top 10% must give up some net income in the 1988 system compared to today, but the incomes of the top earners are primarily redistributed to the high middle class.
History teaches us that heavily taxing the highest incomes was a reality in the not-so-distant past, even in Belgium. However, directly adopting the old system seems like a bad idea. It mainly benefits the better middle class, not the lowest incomes. Moreover, the reform is deficitary. Closing the gaps through a high consumption tax—as in Van Petegem’s proposal—means even more loss of purchasing power for low incomes. Therefore, we also show the impact of an alternative tax system inspired by the 1988 system in the figures. It is similar to the 1988 system in that the effective tax rate for high earners rises significantly. However, it differs from the old system in that it is less generous to the better middle class and more generous to the lowest incomes (by increasing the tax-free amount). The fiscal space freed up by heavily taxing the highest incomes is mainly used to lower taxes for low and middle incomes. This way, the proposal meets the rightful adage that “work should pay more” and can help fill more vacancies in the tight labor market. Moreover, our simulation even indicates that the new personal income tax would collect about 5% more from the working population than the existing system.
Conclusion
Such a progressive reform of personal income tax is not a miracle solution by itself. Income from assets is more unequally distributed than labor income, and it is less heavily and not progressively taxed. Changes are also needed there to achieve a fairer income distribution. Nevertheless, the exercise we have conducted here shows that substantially heavier taxation of the highest incomes was a reality in Belgium in the not-so-distant past. Higher rates for high earners create fiscal space that can be used to allow low and middle incomes to retain more net income. This way, the reform can also make work more rewarding. A progressive reform of the Belgian income tax can therefore combine greater fairness with efficiency gains without creating budget deficits. After two decades without changes to the top rate of personal income tax, it is high time for Belgian politics to work on a fair and efficient labor tax system.
Methodological note:
To determine what the 1988 system (and our alternative) would mean in terms of redistribution and total revenue, we need the Belgian income distribution. We obtain a distribution of annual gross incomes by (1) estimating a so-called double-Pareto log-normal income distribution based on recent HFCS data for the labor incomes of Belgian employees in 2021 and (2) then drawing 4,865,000 individuals (the number of working Belgians) from this income distribution. Although the approach is certainly not perfect, this way we can obtain a fairly representative income distribution and based on this, estimate what the fiscal reform would imply for the working population and the state treasury.
Footnotes
Website FOD Financiën. De ontvangsten geïnd door de Belgische federale overheid: enkele begrippen.↩︎
Tax Foundation. Historical Income Tax Rates and Brackets, 1862-2021 | Tax Foundation↩︎
See this article, figure 3.↩︎
Statbel. The health index. History from 1920 to present.↩︎
OECD.Stat: Gross domestic product per capita (expenditure approach). Constant prices.↩︎
The precise rate structure is taken from the following article. We exclude the then limited levy of 300 BEF on all labor incomes. Decoster, A., & Van Camp, G. (2000). The reform of personal income tax: Lessons from the reforms 1988-1993. Leuven Economic Standpoints, 2000(99), 1-42.↩︎