Inequality has become a hot topic over the last decade, both in public debate and in economic science. It has been ten years since Thomas Piketty brought this important issue to the forefront with the publication of ‘Capital in the Twenty-First Century’. The book shows how income and wealth inequality have increased again in most Western countries since the 1980s. Many researchers have also demonstrated the harmful societal consequences of inequality, affecting social cohesion, democracy, and the economy. Inequality is currently a burning issue, and although the actual inequality is often underestimated by citizens, it evokes indignation in many. Inequality stirs emotions.
But inequality is inevitably linked to another, slightly less glamorous topic: taxes. Few people enjoy paying them, but personal income tax is a crucial instrument to combat inequality.
Progressive, qu’est-ce que c’est?
As a state, you can tax your citizens’ income in various ways. Everyone could, for example, pay the same fixed amount (e.g., €10,000). Such a system is ‘regressive’. Proportionally, a person with a low income pays a larger share of their income in taxes than a person with a high income in such a system. Income inequality after the tax is levied is greater than if there were no tax.
A second type of tax could skim a fixed percentage of everyone’s income (e.g., 35%). This is proportional taxation. The higher your income, the larger the amount you have to give to the tax authorities. Nevertheless, such a tax system does not reduce income inequality. The so-called ‘proportional’ tax means that everyone has to give up the same share of their gross income: the relative income differences between rich and poor remain unchanged.
A system is only ‘progressive’ when higher incomes also pay a higher percentage to the state treasury. When the share of taxes in gross income increases as your gross income rises, it means that income inequality after taxes is lower than the market-determined inequality before taxes.
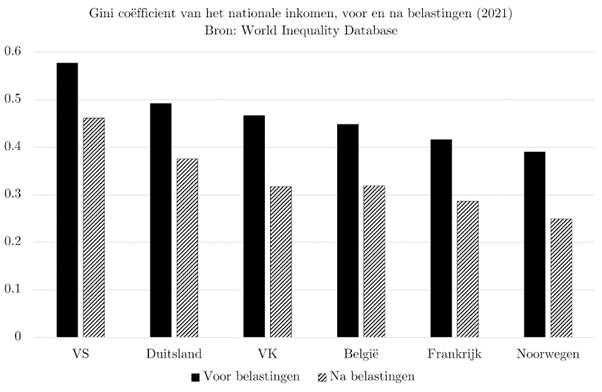
In reality, many governments aim to promote equality among citizens. In other words, they choose to somewhat correct market inequality through the tax system. Figure 1 shows the Gini coefficient for income for different countries. This is a commonly used measure that indicates how unequally national income is distributed among the citizens of that country, although it is not necessarily the best measure. The higher the value, the more unequal the income distribution. The figure shows that the tax system in practice redistributes quite strongly. Even in countries typically labeled as liberal, such as the US, this is the case. That taxes reduce the gap between rich and poor is largely due to the income tax system. For most countries, this is the largest in terms of collected tax revenue. Moreover, it is one of the few taxes with explicitly progressive rates.
The progressivity of personal income tax is thus an essential tool for governments in wealthy countries to correct market inequality. In Belgium, too, the income tax was designed from the outset with this explicit redistributive aim. Jules Ingenbleek, the later architect of the first income tax system in Belgium, deemed it necessary “to compensate for these inequalities by asking the wealthy and affluent classes for an additional fiscal effort through direct taxes.” This first form of progressive income tax was eventually introduced in Belgium in 1919. So, it has been around for quite some time. Nevertheless, there are still misunderstandings about how the system fundamentally works. We illustrate how a progressive tax system concretely works using two myths and an example.
Belgian Income Tax Today
It is sometimes said that hard work is punished in Belgium. Supposedly, you should not earn too much because you would then fall into a higher tax bracket and consequently have to pay more to the tax authorities. In a sense, this is true. A progressive income tax system is one where higher incomes give up a higher percentage of their income than lower incomes. But this does not mean that by earning more gross, you end up with less net income. That is a myth. If your pre-tax income increases, you always end up with more net income. Someone who goes from a gross annual income of €41,360 to €41,361, and thus jumps to the highest tax bracket, pays exactly 50 euro cents more in total taxes due to that transition than before. In other words, only that last euro is taxed at the top rate of 50%, not the entire income. Table 1 provides a worked example.
| Inkomensschijf | Tarief | Belasting in voorbeeld met bruto-inkomen van 41.361 euro |
|---|---|---|
| Van 9.050 euro tot 13.540 euro | 25 % | (13.540-9.050)*0,25 = 1122,5 euro |
| Van 13.540 euro tot 23.900 euro | 40 % | (23.900-13.540)*0,40 = 4144 euro |
| Van 23.900 euro tot 41.360 euro | 45 % | (41.360-23.900)*0,45 = 7857 euro |
| Meer dan 41.360 euro | 50 % | (41.361-41.360)*0,50 = 0,50 euro |
| Totale belasting | 13.124 euro | = 31,7% |
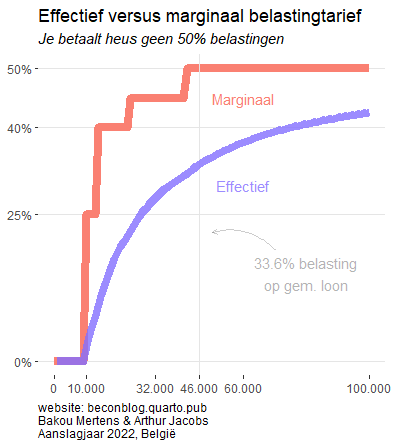
The highest marginal tax rate in Belgium is 50%, and that is also the figure you often hear when you ask people how much tax they pay. But no employee actually pays 50% of their income in income taxes. Only someone with an infinitely large gross income would have to give up half of that income. In the example above, the employee in question (with an income close to the median) pays a total of 31.7% in taxes, despite being in the highest tax bracket. The marginal rates reported in the legal texts are therefore much higher than the effective rate, which is the share of income that ultimately goes to taxes. Moreover, there is a tax-free amount of at least €9,050 (and possibly higher, depending on the family situation). The idea that we pay 50% personal income tax on our wages in Belgium is therefore not really accurate: the effective rate is much lower for the vast majority of the population. Figure 2 shows the marginal and effective tax rates of personal income tax according to gross income.
An important nuance, of course, is that our analysis here only concerns personal income tax itself. In reality, you also pay municipal tax on top of personal income tax. This is calculated as a percentage of the personal income tax, not as a percentage of gross income. This percentage ranges from 0% (in Knokke, Koksijde, and De Panne) to 9% (in Mesen) for the tax year 2023.1 .
Intermezzo: from Gross, to Net Taxable, to Net
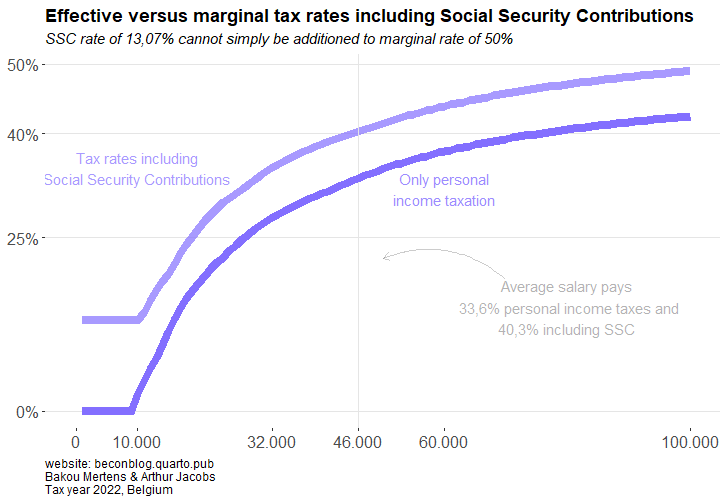
In practice, the employee’s contribution to social security must also be deducted from the gross salary before income tax is calculated on what remains (the net taxable salary). This employee contribution is typically 13.07% of gross income for private sector employees. Unlike personal income tax itself, social contributions are not progressive but proportional (i.e., everyone pays the same percentage). Therefore, social security contributions weigh much more heavily on lower incomes. The figure below shows the effective tax rates with and without social security contributions, depending on the taxpayer’s income. On an average income, including social security contributions, you give up 40.3% of your gross salary to the government. We have briefly discussed these contributions here, but note that social security contributions are not really taxes; they function more like insurance premiums for sickness, disability, unemployment, and retirement. In some other countries, these are privatized, and you pay them from your net salary afterward. In our system, they are handled by the state. Taxes and government levies may seem higher, but in fact, you do not necessarily pay more than if you had to cover all these insurances yourself from your net salary. Moreover, collective insurance systems—besides many other advantages such as broad access to healthcare—also seem to be much more efficient and cheaper.
Top Rate of 50%, Is That a Lot?
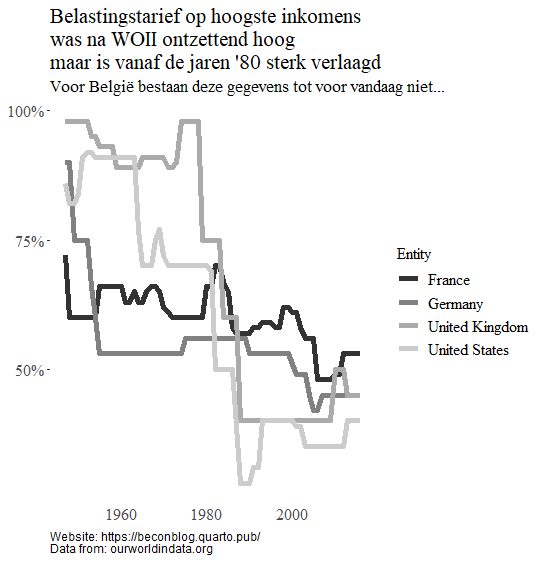
This top rate of 50% is quite similar to the prevailing rate in other Western countries (with the exception of Eastern Europe, where income taxes are often very low and not very progressive). From a historical perspective, however, this rate is very low. Piketty drew attention to the historical decline of top marginal rates in countries like the United States and the United Kingdom. In the not-so-distant past, they had rates as high as 95%. This means that from a certain income threshold, every additional dollar went almost entirely to the state treasury. For us, this seems unthinkable today, but very high marginal rates were a reality in many Western countries for decades.
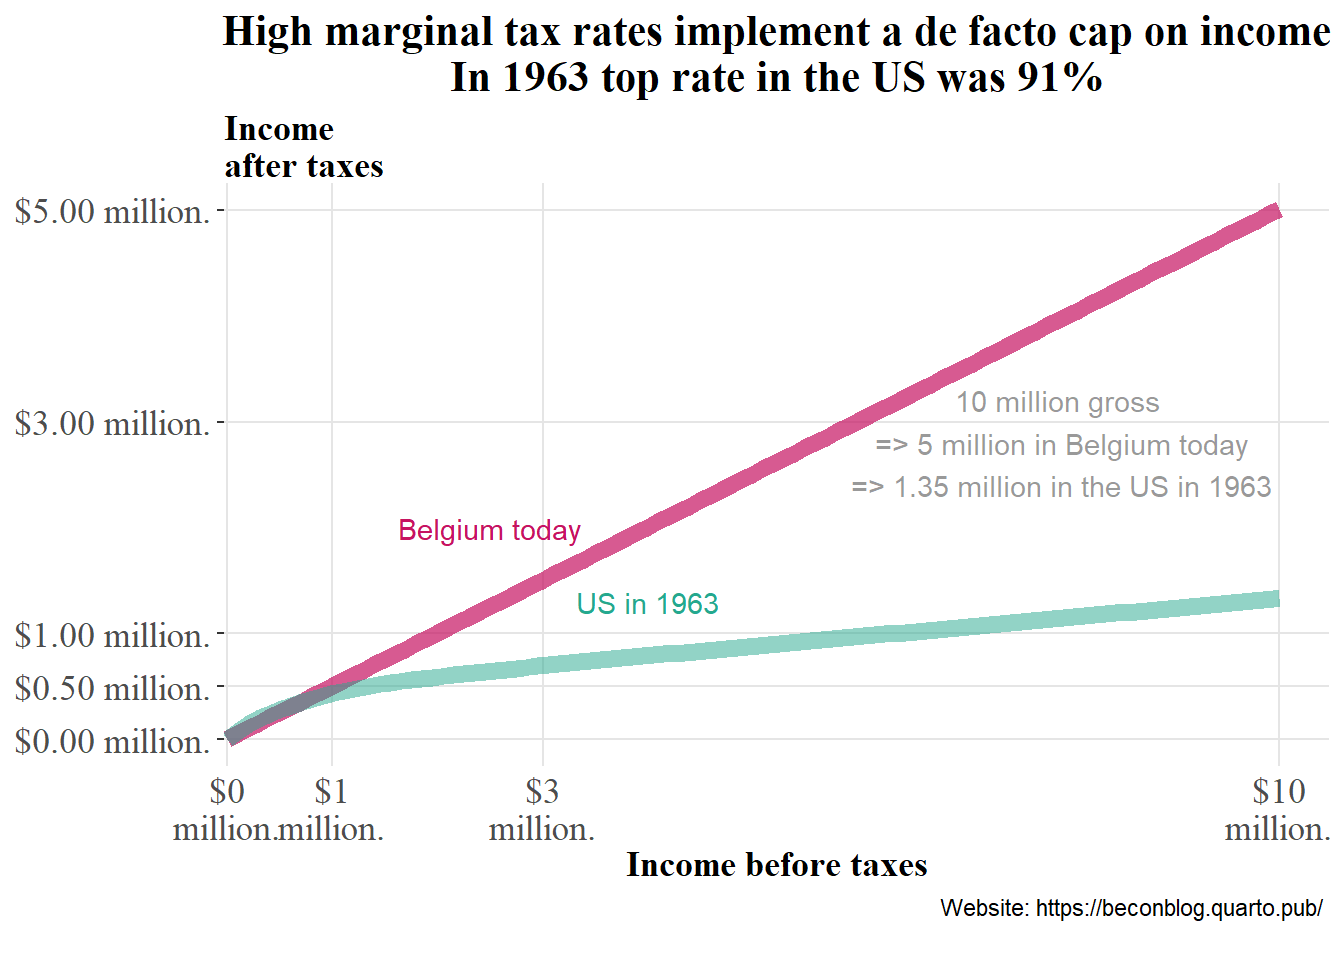
The USA in 1963, a de facto cap on incomes
Such a quasi-confiscation of the highest incomes effectively establishes an income ceiling. It reduces not only post-tax inequality but also pre-tax inequality.
From a certain income level, the tax system in the US and the UK taxed almost every additional dollar of income almost entirely. Such a quasi-confiscation of the highest incomes effectively establishes an income ceiling. It reduces not only post-tax inequality but also pre-tax inequality. For employers, it hardly makes sense to pay higher wages than that threshold, as their employees would not gain any real advantage from it. In 1963, the United States had a top marginal rate of 91% on all incomes—converted to today’s prices, above 3.4 million—90% on all incomes above 2.6 million, 89% on everything above 1.7 million, and so on2. You can see in Figure 43 that post-tax income in 1963 America flattens significantly from a certain income threshold, while the Belgian system does not. Those earning $20 million paid in 1963 America paid 17.8million (88,8% effectrive tax rate) and today in Belgium pay 10million (only 49.99%). In a sense, it was judged in the US at that time that no one could truly “earn” such high incomes.
Very steeply rising marginal rates at the top of the income distribution are thus effectively a tool to limit market income inequality ex ante. Last year, there was an uproar over the generous salaries of some well-known TV anchors at VRT: salaries paid with taxpayers’ money. The response to such indignation is often that these salaries are “market-conform.” In other words, Tom Waes and Jeroen Meus would move to VTM if they didn’t receive €700,000 per year. Even more extreme is the remuneration of top bankers. In Belgium, no fewer than 21 bankers received salaries above €1 million in 2021, according to the European Banking Authority4. Additionally, there is a whole array of CEOs, including those of public companies, with similarly generous salaries, such as the CEO of UCB with a salary of €6.8 million or the CEO of Telenet with over €6 million (in the COVID year 2020)5.
In the case of marginal rates up to 90%, the argument from VRT would no longer hold water. Salaries above a certain threshold would likely no longer be “market-conform.” VTM cannot offer Tom Waes much more net than VRT. Moving to France is not realistic for a Dutch-speaking presenter whose market value comes from name recognition in Flanders. Similarly, Jef Colruyt would probably not become the CEO of the American Exxon Mobil. The typical arguments against high taxes on capital are less applicable to high top rates for income taxes, as labor is not nearly as mobile. That does not mean it is impossible, of course. Just think of the small group of professional cyclists living in Monaco.
Conclusion and Next Step
The fact that there was a de facto income ceiling in the US until 1963 is quite interesting, but not necessarily relevant for Belgium. We know that in various countries, the highest income tax rates have been drastically reduced over the past decades. We also know that this has led to higher inequality after, but probably also before, taxes. However, a clear historical picture is lacking for Belgium. What about the history of Belgian marginal top rates? Did we also have such high marginal rates in the past? And what can we learn from this for potential tax reform?
This article was translated from Dutch using Copilot, you can find the next part is here!